-->

domingo, 29 de mayo de 2016

SEMINAR 4


This session was very useful because we were resolving doubts about the asigantura. Many, many questions .... but our teacher has a great patience!

On the other hand also we had doubts about the research and protocol, in our case we had some doubts and were standing .. such as references, questionnaire, etc. Not only we had doubts ... if not everyone ...... that soothed me! :-P

Also propose exercises on inferential statistics and the teacher showed us how to do statistical tests of our research, using the Epi-Info software, this software is very complicated, at least until you practice a lot.

I hope to have good luck in the exam on June 24.


SEMINAR 3


Today I speak of the seminar 3. In it we were reviewing statistical concepts such as: types of variables(quantitative and qualitative), the central measures (mode, mean, median). This review was successful because we have to move forward in the investigation and had some concepts that still did not handle well.
Our research is "see the need for a nurse in schools". So we've selected 2 schools of Sevilla, one has nurse and one does not. In both schools there are children with diseases.
We also talked about the research protocol, which is like a general outline of the research project. In it there are different points, such as objectives, the theoretical framework, the study population ...
Apparently we're doing very well! Although we are going crazy to our teacher Manu.....
Thanks team! L & S


SEMINAR 2


In this seminar we explain cases awarded to us. Each group was responsible for the resolution of a case. Search databases did not suit us very simple, not having much practice yet.
My group investigated about diabetes and whether individual recommendations were better than the collective.
I was a bit complex job performance because it was a bit wide and had to do things we had never seen, on the other hand we did not have much knowledge of the document. Although it was complex, I can say that has served us for the rest of the course, because the search database provides you with information on scientific subjects. I learned a lot thanks to the extensive effort that we had to do to carry out the work. I have to thank my teammates, Lola and Silvia, because our work was successful.


sábado, 28 de mayo de 2016

SEMINAR 1

In this first seminar we learned to create, improve and use a blog. I have learned to create the blog to my diary, also with the help of this seminar I managed to add "gadgets" and "tickets" to my blog. I hope to continue with this learned and write my progress on the signature and the seminar. In this seminar, we have also learned to perform literature searches. This is essential to find literature on scientific bases, and so choose those items and magazines recognized for good jobs.
the bases that we recommend to our searches are: pubmed, ENFISPO, Scopus, CINAHL, etc.


See you...

...everything begins and everything ends ....

This subject has seemed difficult while interesting, is a departure more of our profession and without hesitation the take the opportunity.
We have learned to handle unknown concepts to date and from now when we see a statistical study we will know what we are reading.

For now I'll stop up post. Now begins the dreaded exam time and I have to give everything, so I will focus only to study the meantime here you have stuff to entertain yourself!
Wish me luck and It's in the lap of the Gods.

See you very soon!


LESSON 10


HIPOTHESIS TESTING

To begin, we made a brief introduction to test hypotheses, which are statistical tools to answer our research questions: it allows us to quantify the compatibility of a previously established assumptions and results obtained.
Depending on the variables involved in the study of our research will use the following tests: Chi Square test, T-test, ANOVA and regression lineal.

Secondly we study hypothesis errors. We call error probability of being wrong in rejecting the null hypothesis. The slightest mistake we can reject H0 is the p error. Normally we reject H0 for a maximum level of error of 5% (p <0.05)

If we have to reject the null hypothesis, the test does not tell us that we have to take alternative hypothesis, it is the researcher who decides it according to the results. This is what we call "statistical significance"


Qualitative
2 group
Qualitative
+2 group
quantitative
Qualitative
2 group
Chi square
Chi square
T student
Qualitative
+ 2 group
Chi square
Chi square
ANOVA
quantitave


Regression lineal


LESSON 9


STATISTICAL INFERENCE

This lesson is more difficult than previous 8 and is not very interesting, but hopefully doing exercises come to understand without problems.

The biggest problem I've found in the calculation of sample size, because I don´t find meaning to the formulas applied

In conclusion, for me this lesson has been the most complicated of all, due to the large amount of content you have and the high degree of difficulty of the practical cases.

What a palaver!


LESSON 8


MEASURES OF CENTRAL TENDENCY, POSITION AND SPREAD.

While it is raining cat and dogs, I use my time to explain how to statistics.
This lesson is not my intention to explain the theory, because if you've got here I hope you have learned or theory you've got another thing coming !!! :-)

There are 3 types of statistical measures:

* Measures Position: here remember concepts as percentiles, deciles and quartiles.
* Measures of central tendency: and here we must remember how to calculate the mean, median and mode
* Measures of dispersion: learn to calculate the range, mean deviation and standard deviation.

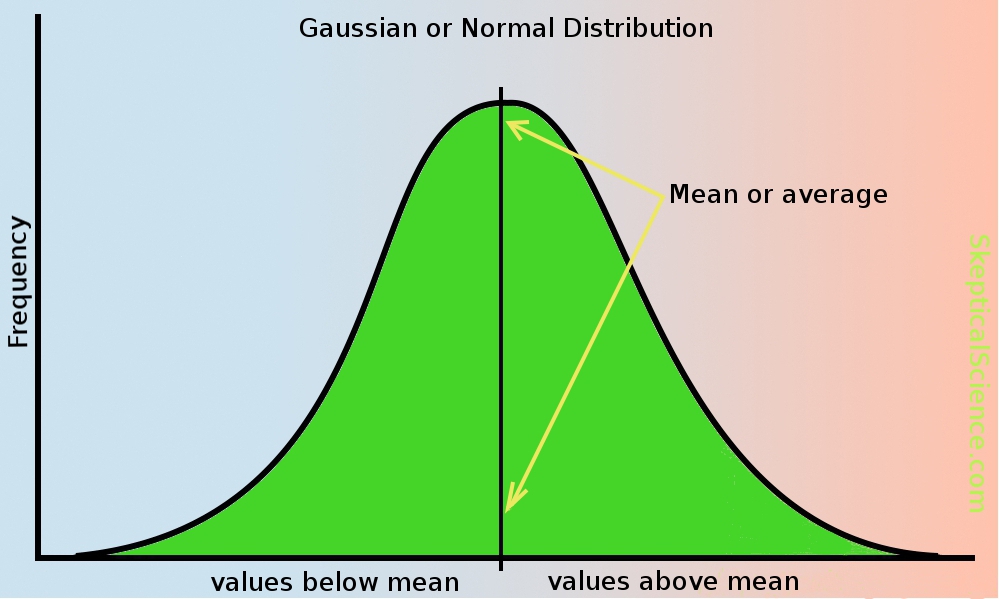
Another important concept is the bell "Gauss" in statistics is called normal distribution is symmetric and the mode, median and mean are similar.


LESSON 7

INTRODUCTION TO BIOSTATISTICS

In this lesson we talked about the introduction to biostatistics.
To begin we learned that there are different scales for measuring variables

* Nominal Scale: here check if two subjects have equality or difference. The characteristics must be: exhaustive (that all individuals can be classified within the scale) and exclusive (can not match more than two cases a person)

* Ordinary scale: this scale is possible to establish whether the two variables are the same or different, and if they are different or different determine which of them is greater.

* Measuring range. Interval scale. It presents the characteristics of the previous two scales: identity and order.

* Measuring range. Ratio scale. It is the highest level of measurement. It has features of the previous three scales: equality / inequality, order and equivalent distances between intervals.


Second we have also seen that there are several types of variables. We can classify in:

*Qualitative: properties that can not be measured. can not be used to measure the level of knowledge, marital status ... Two types:

a) Nominee. Two types -> dichotomous: 2 levels of categories and polychotomous: more than 2 categories.

b) Ordinal: establish an order


*Quantitative: it is those that can be measured in arithmetic terms. Two types:


a) discrete: You can take a finite number of values.
b) Continuous: which can be worth any number within a range


At the end we learned how to make a frequency table, which is the representation of data showing frequencies in columns and categories of variables in the ranks. It presents repetitive information visible and understandable and different types of graphical representations from which communicates information quickly enough.


LESSON 6

EMPIRICA STAGE OF RESEARCH

The lesson is divided into design, material and method.
Within the material and method we distinguish:
* Study population: selection of individuals
* Sampling
* Size
This is followed by a schedule data collection as well as a record and procedure. Behind them is continued data collection and analysis thereof.

There are three types of design:

1. descriptive design: a prevalence study.

2. Analytical design: measures the strength of association between two variables. It can be: cohort study or follow-up (prospective or retrospective) or case-control study.

3. Experimental design: the independent variable is introduced by the researcher. There are hypotheses, not limited to observar.Puede be clinical trial or quasi-experimental.

As a result, measures of association home one of the studies, the prevalence, incidence and relative risk are explained.

EXAMPLE:

In a population of 15,000 people you want to know what is the incidence of breast cancer in women between 50 and 64 years.
The population is made up of 8500 women, of which 15% are between 50 and 64 years. Of these, 15 have already been diagnosed with breast cancer. After a year of active follow-up, 6 more cases were detected. What is the cumulative incidence in this population?

8.500 Woman------- 15% Between 50/64 years ========== 1275 women

1275 women:
                       15 Breast cancer
                       1260 without disease --------- over 1 year, 6 more cases

Cumulative incidence = 6/1260= 0´0047 for 1 year. It´s mean that the acumulative incidence is          0´47%  for 1 year.


Finally say that this lesson has been very difficult and boring and I have had to spend many hours of study to get to understand, especially to be able to identify the types of studies.


LESSON 5

FRAMEWORK AND OBJECTIVES OF RESEARCH

In this lesson we saw the concept of theoretical framework, which seeks to define where we want to go with the research we want to achieve.
To build a theoretical framework requires four steps:

*Formulate precisely a question of the patient or of the unit.
*Locate the evidence available in the literature.
*Critical evaluation of the scientific literature or evidence.
*Implementation of the conclusions of this evaluation practice.

 This topic also saw the concept of hypothesis, which is merely a statement of the expectations of the research, about relationships between variables that are queried.
 It is therefore a prediction of the results expected to get between two or more variables.
Where we have independent variables (which are those that explain) and a dependent variable (from which we get the result)
For example, in a study to associate the number of blood pressure and the incidence of stroke.
Independent variable: Blood Pressure.
Dependent variable incidence of stroke.
When there is no relationship between the variables, called null hypothesis.
When there is a difference between the two, we call alternative hypotheses.
For example know whether snuff consumption influences the occurrence of COPD.
Null hypothesis: there is no relationship between consumption of snuff and COPD.
Alternative hypothesis 1: snuff increases the risk of COPD.

Alternative Hypothesis 2: snuff reduces the risk of COPD.

A few steps from being an expert in research!!


LESSON 4


SOURCES OF INFORMATION AND BIBLIOGRAPHIC REVIEW.

To Begin with we have learned the use of the literature review useful to select the data that interest us and compare between them.

Secondly, we study the source field information, which is information we obtain or provide us with the study subjects. This information can be obtained by:
  •   Direct observation of the researcher. Here you can make mistakes by:
                       The observer
                       By the instrument used
                       The phenomenon observed.
  •  Interviews: it is not a useful measure in statistics, because we do not get statistical data.

      Interviews can be structured (the questions are clear) or unstructured (without guion only a few questions that the researcher uses to extract information

  • Questionnaires: in statistics is the most used.

         With questionnaires obtain information about a larger number of people in a short time, be able to interpret the data ... but the downside is that they are inflexible.

Finally we saw develop a questionnaire and the advantages and disadvantages of open and closed questions, which was very useful for to do our own research for work.
To develop a questionnaire just follow a few steps:

*Identify  variables
* Search questions already set and previously tested (this aspect I see important because so sure know           you will not make any mistakes when collecting data)
*Choose the right questions.
*Define the codes, scales and ratings (Likert scale or Bartell scale)
* Evaluate the quality of the questionnaire.


To sum up this lesson is a important point for my research,  because good research is based on proper data collection for then to analyze these are correct.

lunes, 9 de mayo de 2016

LESSON 3

CONCEPTUAL STAGE OF RESEARCH
in this lesson we have learned the importance of finding the topic for which investigate and assess the problem.
First of all, you have to have good ideas, this depends on the professional that generates and the questions it done. It is also essential to update the information and knowledge that exists around our questions before the investigation that may have been modified since they were started studying.

After that, we must establish the theoretical framework and identify the variables to be defined. Once this is done, you have to see the number of people that we will submit to the investigation, measuring variables accurately devise a strategy analysis and finally interpret the results with caution so that when communicate is a viable information and quality.
On the other hand we Have in mind when developing an investigation if the variables are feasible to measure the time to onset of the result is right, the opportunity exists to achieve this, the availability of people, possible collaboration with other professionals, existing economic resources and experience of the research team and the interest socially.

The latter is very important because we must think about the benefits that can be derived from our research, practical applications that can be obtained and social interest it generates.

I hope this post has been helpful and that you have in mind when starting a research process.

I leave some links where you can find reliable sources of information.
http://www.ncbi.nlm.nih.gov/pubmed/
http://dialnet.unirioja.es/

LESSON 2

STAGES OF PROCESS RESEARCH. In this issue we have seen the phases of the research process. So I'll tell you shortly what each one. The research process is divided into three stages, called conceptual, empirical and interpretive. CONCEPTUAL STAGE: At this stage we get the following questions, what research and investigate why? And we follow the order: Observation of facts, identification and formulation of problems, literature review, theoretical framework, problem definition, defining objectives, operational definition of terms and variables, hypothesis formulation (if we propose a relationship with another factor) and importance of study and limitation . this stage we consider the most important and most complicated. EMPIRICAL STAGE: At this stage we formulate the following question: how to investigate? This stage is the most practical, and corresponds to the research planning (material and methods), define the study population, sampling, variables, problem definition data collection and processing and registration. Fieldwork (run all of the above) and analyze the data. This stage should ensure control or testing, ie should be as reliable and it must have an internal and external validity. INTERPRETIVE STAGE: will at this stage validation of methods and results, describe the strengths and weaknesses of the study, the findings will relate to the objectives or hypotheses we posed, we will discuss the novel and relevant aspects and will draw conclusions. In this issue we have also seen the possible errors and biases that may occur in a study if you do not consider. Where we can find random errors and systematic errors or bias that may be sorting, selection and confusion. In the following topics we will develop gradually each stage, so that in our future research commit less errors or possible bias and has high reliability and accuracy.